
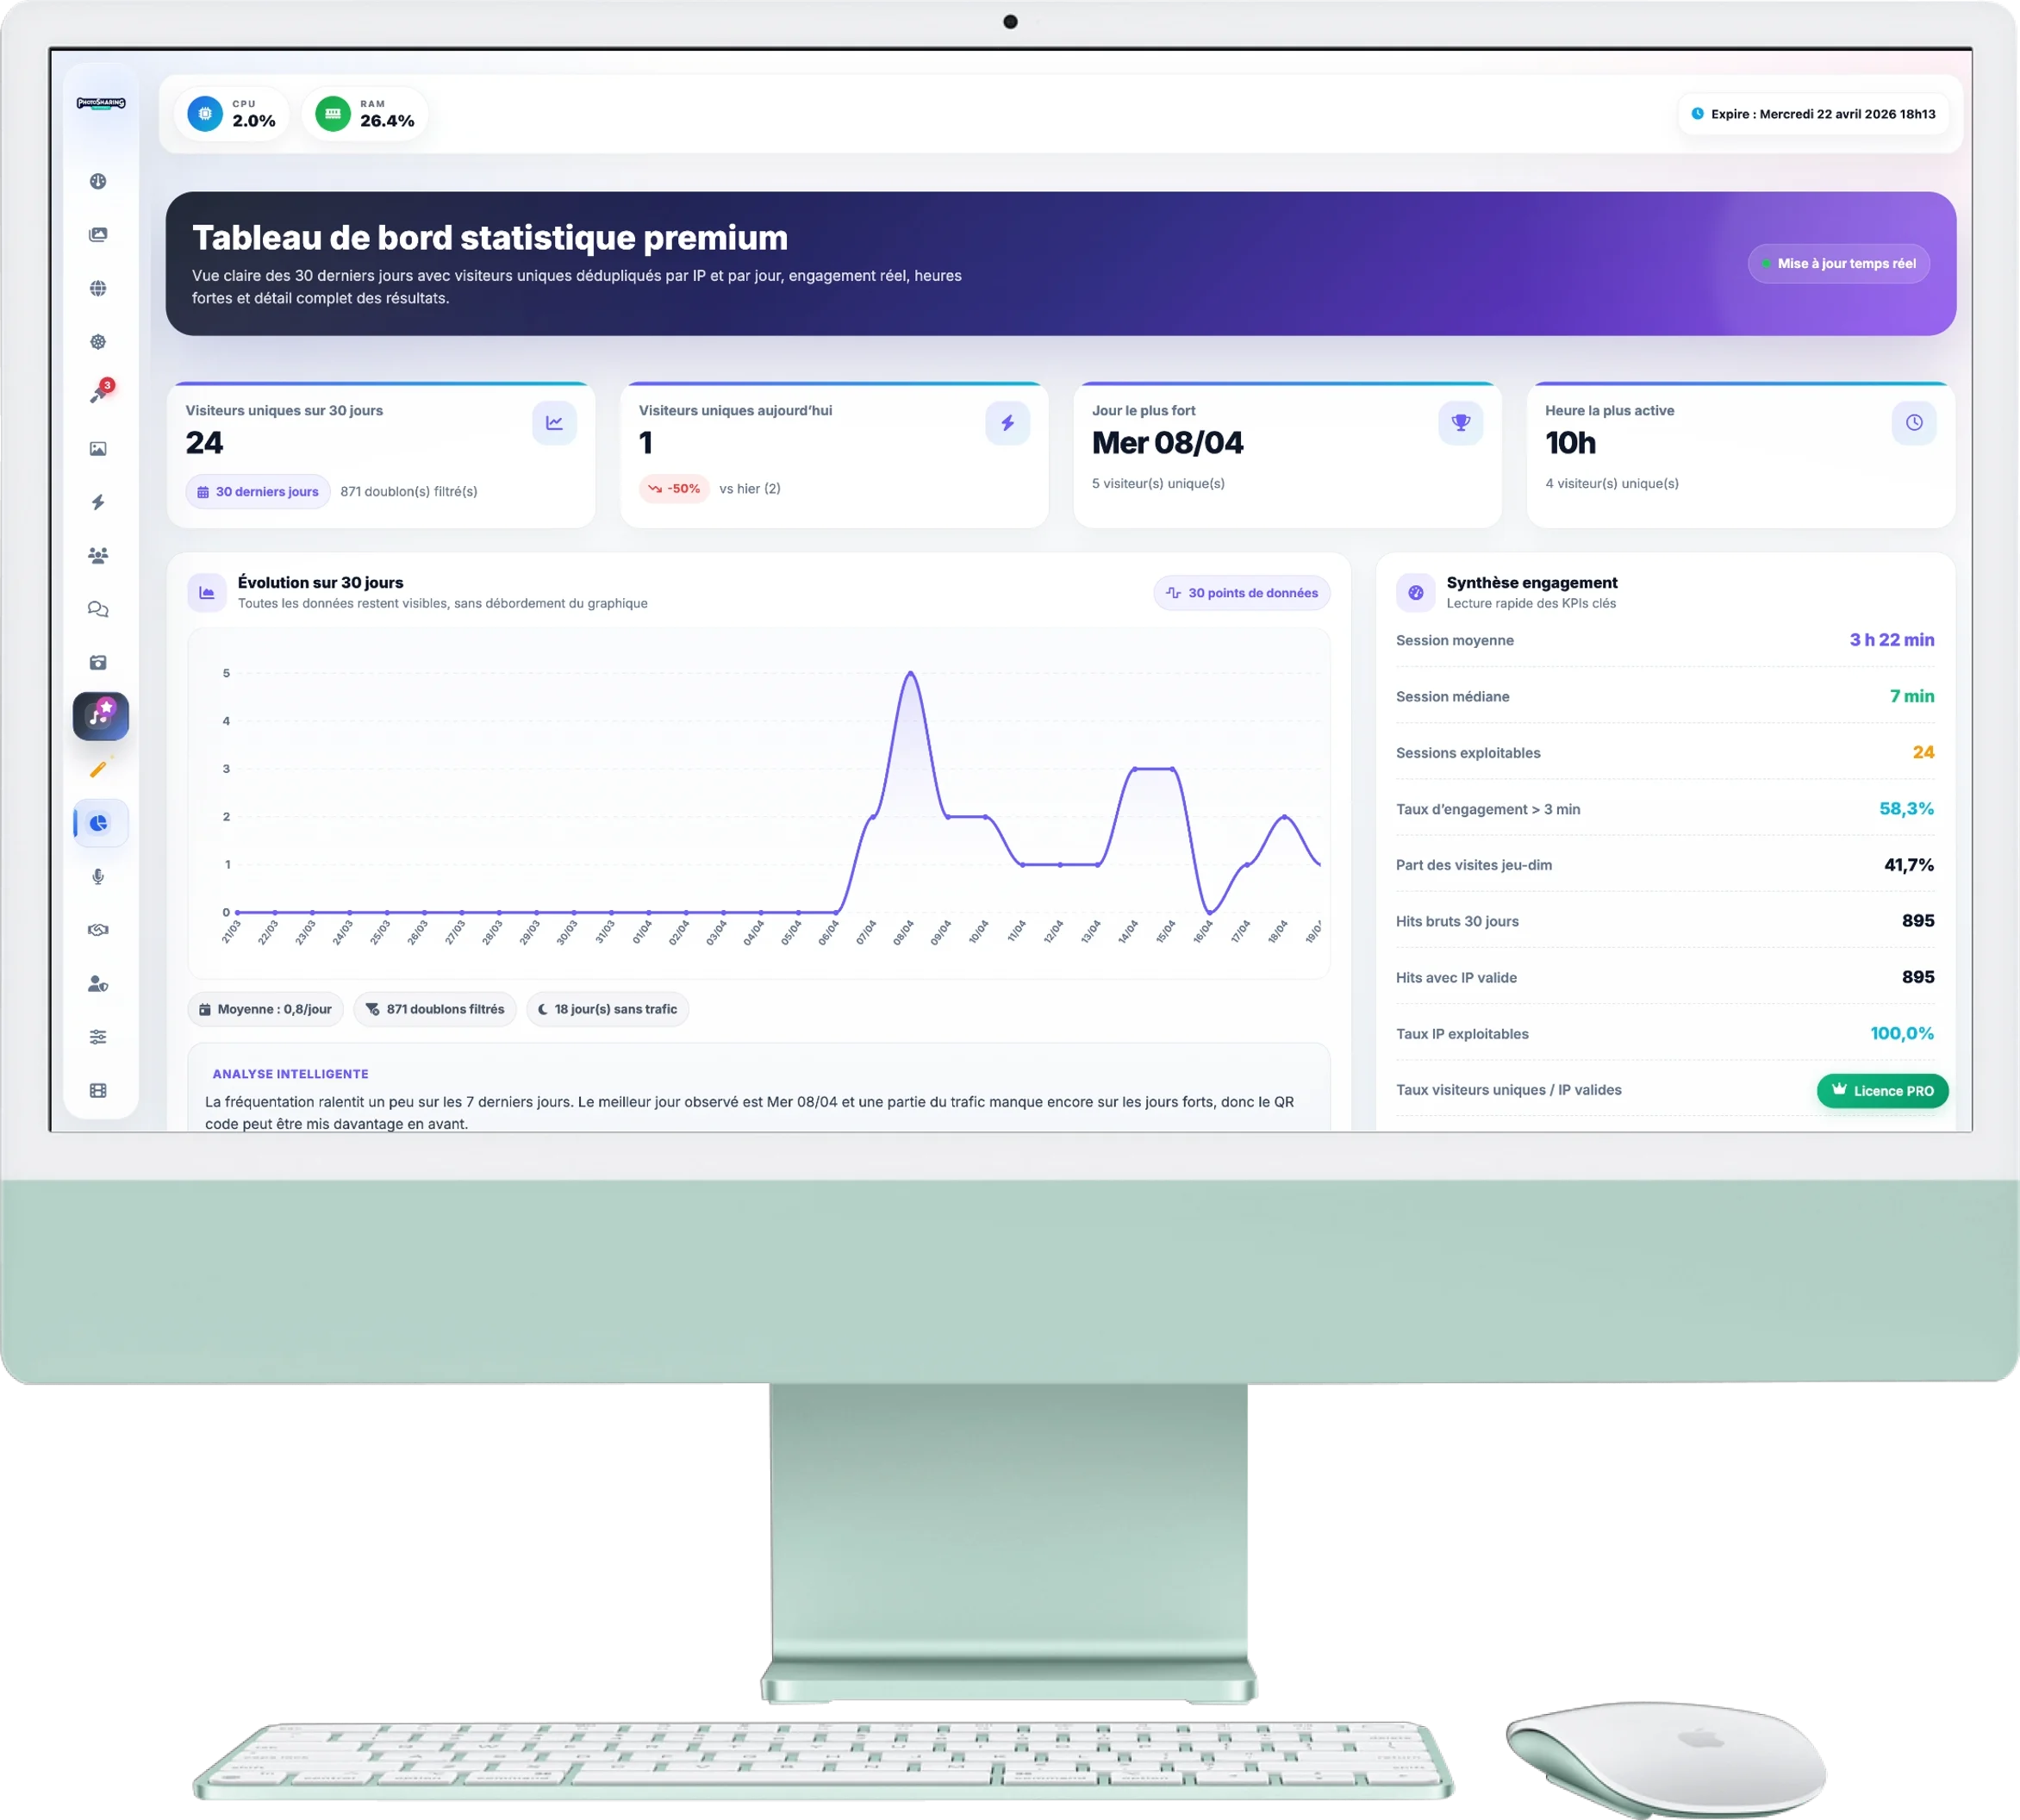
Premium statistics dashboard
Measure the success of your animation! This page gives you a clear and detailed view of the last 30 days: unique visitors, real engagement time and detection of peak times.
1. Global Indicators (KPIs)
The 4 upper inserts give you the general trend of your event:
- Unique visitors: Total traffic over 30 days and the current day (with a trend arrow compared to the previous day).
- Records: The day with the most connections and the most active time of day. Ideal for knowing when the mood was at its peak!
2. Evolution & Summary of Commitment
The large central graph traces the evolution of your unique visitors over the month:
- Intelligent Analysis: An automatically generated text below the graph summarizes the trend (acceleration, decline, stability) to help you interpret the curve.
- Commitment summary (right): Find out the average and median session (how long a guest stays logged in), overall engagement rate, and pure traffic volume.
3. Crowd & Top Rankings
Understand the behavior of your guests to better manage your next events:
- Peak hours: A detailed 24-hour graph that tells you precisely when the platform is most visited. This is the perfect indicator for knowing when to remind guests to scan the QR code on the microphone.
- Top Days & Hours: Two lists ranking the top 5 days and top 5 times of your event.
4. Data quality (Anti-cheat)
To guarantee reliable statistics:
- The system automatically filters irrelevant visits and limits duplicates to keep more reliable statistics.
- A complete "day by day" history is available at the bottom of the page, as well as a histogram of the distribution of session times.